 | Consumer Metrics Institute News Feed Subscribe to Consumer Metrics Institute News by Email |
Consumer Metrics Institute
Home of Daily Consumer Leading Indicators
| Consumer Metrics InstituteHome of Daily Consumer Leading Indicators |
| Home | History | Automotive | Entertainment | Financial | Health | Household | Housing | Recreation | Retail | Technology | Travel | FAQs | Downloads | Membership | Contact | About |
| April 12, 2011 - Updated Charts and Mr. Bernanke's Dilemma: We have had to update a couple of our charts as a consequence of the continued contraction in our Daily Growth Index. In its original form our "Contraction Watch" covered just a quarter's time span -- since in January 2010 we did not expect the contraction event to last much longer than that. We have now had to expand the horizontal time scale on six separate occasions, with the latest rendition reaching 540 days (or 18 months): 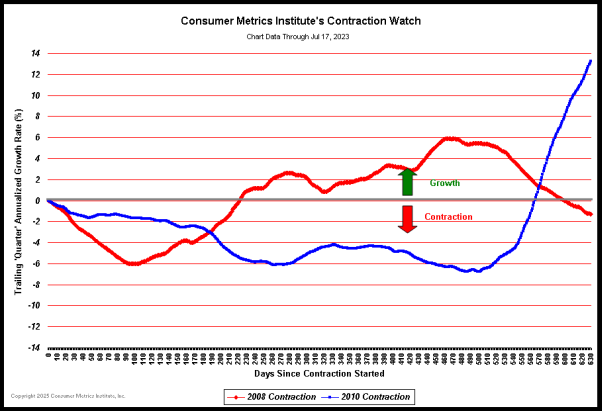 (Click on chart for fuller resolution) As we have mentioned before, our "Contraction Watch" follows the Daily Growth Index and compares it on a day-by-day basis with the same index during the dip created by the "Great Recession" (with the plotting for each event starting on the first day that the Daily Growth Index started to contract). We feel that this single chart is perhaps the best way to visualize what has been happening with the consumers that we monitor, and that chart is still not showing any signs of a sustainable consumer driven "recovery." In fact, the chart shows that the Daily Growth Index is rapidly approaching its previous record low value set on October 4, 2010 -- and it has again surpassed the lowest values seen during the 2008 contraction event. Regardless of what is happening in the economy as a whole, the consumers that we track are either not participating in the upside or have chosen to be cautiously frugal until they see clearer signs of recovery. The extended nature of the contraction had also completely destroyed the logic behind another one of our charts. Our "Contraction Severity Gauge" attempted to help our members better visualize the "area under the curve" in the our Contraction Watch, and at the same time forecast as best we could the ultimate extent of the 2010 contraction. Unfortunately, our initial projection logic broke down when the duration of the contraction event substantially surpassed our experiences with the 2008 event. We have now recast our projection logic to be an average of four different potential contraction ending scenarios, based on different combinations of curve fitting strategies using both the 2008 contraction and the greatly prolonged 2010 (current ongoing) event. That chart now looks like this: 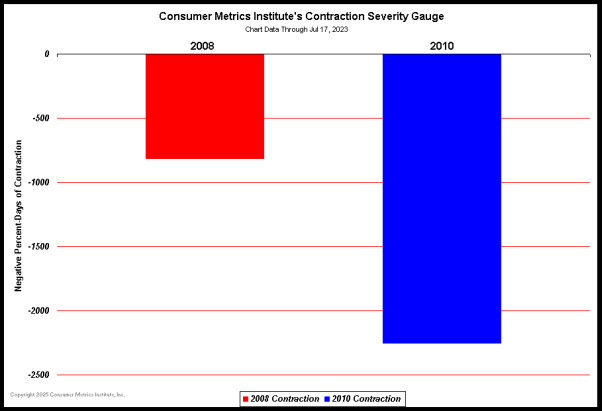 (Click on chart for fuller resolution) As alarming as the projection now appears, it reflects a mathematically derived duration of nearly an additional 11 months. At that duration the severity ratio relative to 2008 would broadly match the ratio between the aggregate consumer real estate net-worth losses through 2008 and recent projections for the aggregate value of those same losses a year from now. And as our Daily Growth Index (our 91-day trailing average of our Weighted Composite Index) approaches record territories again, we thought that it might be useful to show the movement of all three of our trailing averages over the past 48 months: 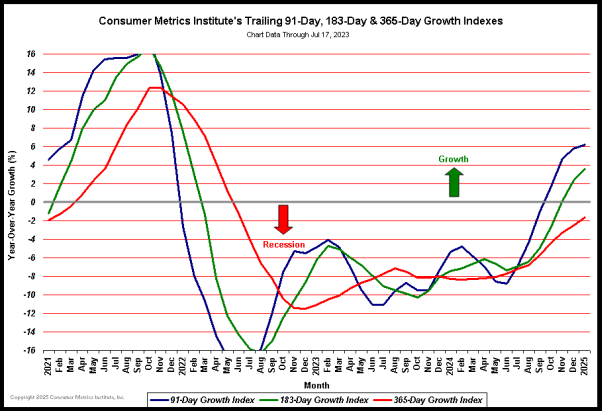 (Click on chart for fuller resolution) Although we regularly focus on the 91-day moving average and its descent into record territory, the 183-day average and the 365-day average have been setting new record lows every day since September 2010. This contraction has been long, and it isn't over yet. QE-2 End-Games - Mr. Bernanke's Dilemma QE-2 is supposed to wrap up sometime in June. The question is: will it actually end in June? Or, to rephrase that question in a more political context: is it in anybody's interest to have it end then? It may be useful to reflect back to a time a little over two years ago when most economists were concerned that the Federal Reserve had expended all of its monetary policy weaponry against the "Great Recession" to no avail, caught in a version of what Keynes characterized as a "liquidity trap." Interest rates were effectively zero, and yet credit was not growing and the economy was not recovering. It was becoming clear that two factors were at work: ► Banks were loathe to loan new monies to non-credit-worthy borrowers; ► And other borrowers who were still credit-worthy simply wanted no more debt (explaining in large part why they had remained credit-worthy in the first place). In fact, even existing credit was being extinguished as credit-worthy borrowers deleveraged and non-credit-worthy borrowers defaulted. In short, we were experiencing a very real credit collapse. And the Federal Reserve was then presumed to have no conventional monetary tools left that could reverse that situation. That's when Mr. Bernanke entered the realm of the "unconventional," borrowing a tool previously used by the Bank of Japan to deal with its own great recession -- now nearly two decades old. That tool was "Quantitative Easing" (QE) which amounts to the central bank injecting liquidity directly into the banking system by swapping fabricated-from-thin-air excess bank reserves for outstanding governmental or commercial debt instruments. From a balance sheet standpoint this process essentially expands the Federal Reserve's assets by the amount of the purchased debt instruments and offsets those assets with liabilities in the form of freshly minted bank reserves electronically fabricated and credited to the money-center banks' accounts. The Federal Reserve's initial experiment in QE (starting in November 2008 and now known as QE-1) was also used to move vast amounts of lower quality mortgage-backed securities from the balance sheets of commercial banks to the balance sheet of the Federal Reserve. By June 2010 the Federal Reserve had increased its total portfolio of securities by $1.58 trillion, of which $1.13 trillion was mortgage backed securities. In the first quarter of 2010 it was thought that a full recovery was underway, and the Federal Reserve began to contemplating "unwinding" its positions. But by August 2010 the recovery had begun to look less robust, and another round of QE (now known as QE-2) was announced. The initial QE-2 purchases were designed to simply offset the shrinking value of the mortgage-backed securities with fresh U.S. Treasury issues (because the value of the Fed's mortgage-backed securities portfolio has shrunk by nearly 18% since May 2010 as a consequence of normal principal payments, refinancing retirements and some foreclosure activity). But by December 2010 the purchases had increased substantially beyond what was necessary keep the total portfolio balance level, bringing the total of all Federal Reserve QE purchases (QE-1 and QE-2) through early April 2011 to $2.02 trillion, with an additional $0.20 trillion planned before the end of June 2011. It's reasonable to ask what over $2 trillion of additions to the Federal Reserve's balance sheet has accomplished: ► Since QE-1 commenced in November 2008 the Federal Reserve's Employment-Population Ratio has dropped from 61.4% to 58.5% (i.e., nearly 3% less of the population is employed). Meanwhile the official headline unemployment rate grew from 6.8% to 8.8%; ► Household income has stagnated in the face of price inflation in household staple commodities: corn prices are up 103%, oil prices rose 122% and cotton spot prices quadrupled; ► The longer end of the Treasury's yield curve rose over 200 basis points (80%) from a bottom reached in December 2008. ► On the home front, residential real estate prices have dropped an additional 9%, housing starts have dropped an additional 10%, and foreclosure filings increased 23%; But on the brighter side of things: ► The price of Gold is up 75%, the S&P 500 is up 48% and earnings per share for the S&P 500 are up 39%. As with many experiments, QE has generated some unexpected results. As an example, by conventional economic reasoning the injection of vast amounts of new liquidity should not have driven long bond rates (or mortgage rates) up. As another example, banks were expected to put more of that liquidity to use in ways that stimulated real commerce. Looking at the big picture, we might wonder: what are the observable macro-economic results of the Federal Reserve's great QE experiment since November 2008? At least two observations come to mind: ► There has been a bubble in financial assets and commodity prices, even as real estate prices have continued to deflate. This has been largely due to the mechanism used for the injection of the liquidity -- increasing the excess bank reserves of money-center banks. Those banks, in turn, deployed the excess reserves in the ways that they felt would generate (for them) the greatest profits -- speculating on financial assets and commodities (and certainly not real estate or mortgages). ► Despite the financial bubble, "Main Street" Americans have fewer jobs per capita, lower household worth and less disposable income. This can be considered collateral damage from the use of self-serving banks as the liquidity recipients, since essentially none of the liquidity has been put into productive capital that can grow U.S. commerce, jobs or median real household income. The experience of "Main Street" Americans during QE has not been materially different from the experiences of their Japanese counterparts over the past ten years -- a history that the Federal Reserve surely understood before injecting $2 trillion of liquidity onto the balance sheets of select U.S. banks. So, why has QE become the stimulus tool of choice? The Bank of Japan's answer is simple: presumably things would have been much worse without QE -- i.e., the injected liquidity neutralized (to some extent) an ongoing deflationary credit contraction. And, not so incidentally, they had no other tools left in their monetary toolkit. By the way, after nearly ten years of QE, the Bank of Japan has not been able to execute an exit strategy. But they have learned two critical things: ► Nobody really cares about central bank balance sheet bloat; and, ► They were able to monetize and even further domesticate their government's sovereign debt, keeping the unprecedented debt/GDP ratio affordable and deferring the need to address the structural fiscal deficit issues -- and all without trashing their currency's exchange rate. As a stimulant for Japan's economy, QE was arguably a complete failure. But by happy accident, the experiment managed to kick an a 200% debt/GDP ratio (twice as bad as in the U.S.) down the road for a decade. That happy accident is not trivial, nor is it likely to have been overlooked by Mr. Bernanke. As little as a year ago economists were concerned about the possibility of the U.S. Treasury's largest creditor (China) suddenly dumping their holdings to repatriate their stash of foreign exchange surpluses for domestic use. That is literally no longer a concern -- simply because the Treasury's largest creditor is now the Federal Reserve (compare the Fed's current $1.35 trillion holdings to China's measly $1.16 trillion). The Fed has roughly doubled its holdings over the past year, and at their current pace of year-over-year Treasury acquisitions Mr. Bernanke could (and almost certainly would) sop up the entire Chinese position in less than two years. Perhaps more importantly, for the past five months the Federal Reserve has bought and monetized the entire net new U.S. Treasury debt. If we engage in some (presumably) hypothetical arithmetic in something akin to economic "magical realism," the Federal Reserve has put into place and tested a means of monetizing over $100 billion in new U.S. Treasury debt per month -- potentially (and magically) financing a $1.4 trillion annual fiscal deficit for at least a decade (if Japan's experience and 200% debt/GDP ratio are any guide). And above all, on the short term this financing would be painless for the electorate and a bonanza for the financial elite. Consider for a moment that there are only three broad options for Mr. Bernanke at the end of June: ► Unwind the cumulative effects of QE-1 and QE-2, sending us back to late 2008 in more ways than we would care to remember; ► Restrain new purchases but hold the current inflated balance sheet levels intact, eventually causing budget-busting debt servicing costs as the Treasury falls into the unwelcoming arms of the "bond vigilantes"; ► Continue QE either directly or indirectly, while selling "Main Street" on how great the equity markets have done. If Mr. Bernanke has learned his lessons well, there is no dilemma. It's an almost magical "no-brainer" that only our children may regret. | ||